As a financial advisor, back office processor or manager, your world revolves around numbers and data. You use data to understand your clients and personalize your recommendations, track performance and ensure everything clears the queue — the list goes on and on.
Data management and reporting are crucial to success and rely on quality systems that gather, sort, and store data. As technology advances, so too do reporting requirements. How firms and advisors track progress and manage their reports is changing, and advisors who use intelligent, data-powered systems can streamline operations and gain better insights into their clients, the markets and their firms.
The speed of investing is increasing, and today’s clients want information faster than ever. As the financial services industry becomes more competitive, speed is essential. But firms can’t sacrifice quality for speed — it doesn’t matter how fast data is if it isn’t accurate. Operations personnel and advisors need accurate, up-to-date information they can act on right away.
The answer to this problem is real-time reporting, which allows advisors and the ops team to stay on top of progress and goals. Real-time reporting on everything from NIGO numbers to time spent in stages makes it easy for users to monitor progress and ensure everything happens on time. With real-time numbers at the time a report is called, users have the most updated information to make informed decisions and respond to questions and issues as they arise instead of letting crucial time pass. They can make decisions with accurate data and avoid making corrections later.
Data Visualization
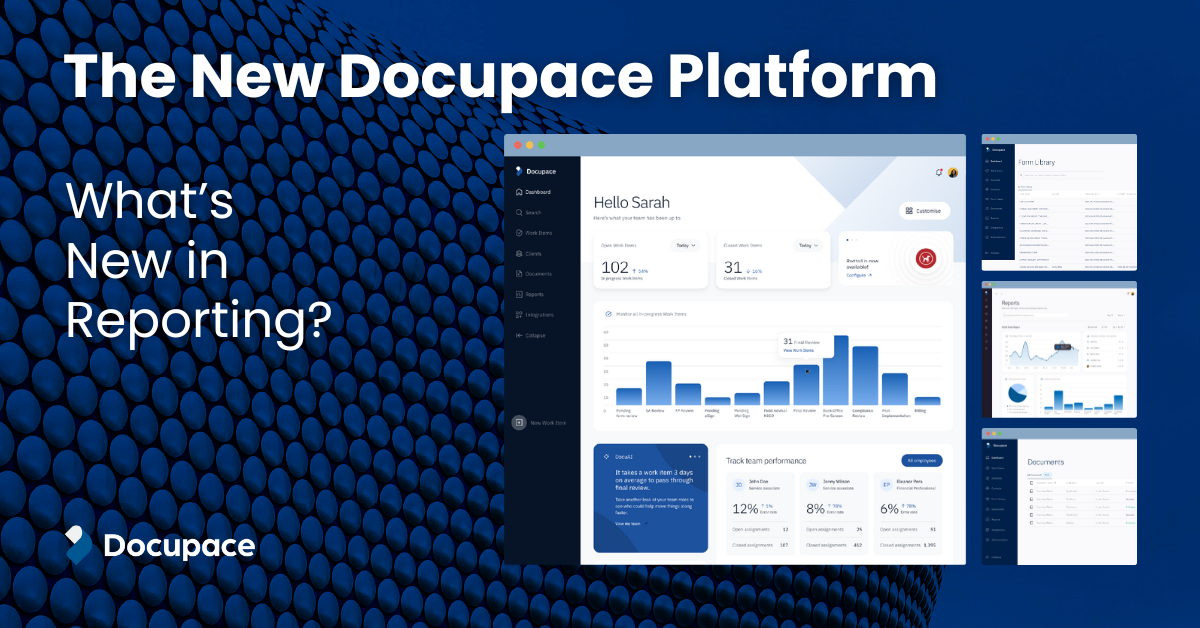
Reporting is driven by numbers, but a modern approach to reporting relies on the visual elements as much as the numbers themselves. Using interactive dashboards, charts and graphs to showcase real-time data allows advisors and users to quickly see the status and progress of benchmarks without having to sort through mountains of text.
Let’s consider NIGO reporting as an example. Understanding NIGO trends is crucial for firms to stay compliant and avoid issues, but traditional reporting can be complex and cumbersome. Visual reporting comes through in a graph to monitor the percentage of NIGO errors over the month, a bulleted list of employees with the most errors reported next to arrows showing each person’s up or down progress, pie charts of NIGO by work item type and more.
Reporting is driven by numbers, but a modern approach to reporting relies on the visual elements as much as the numbers themselves. Using interactive dashboards, charts and graphs to showcase real-time data allows advisors and users to quickly see the status and progress of benchmarks without having to sort through mountains of text.
Let’s consider NIGO reporting as an example. Understanding NIGO trends is crucial for firms to stay compliant and avoid issues, but traditional reporting can be complex and cumbersome. Visual reporting comes through in a graph to
monitor the percentage of NIGO errors over the month, a bulleted list of employees with the most errors reported next to arrows showing each person’s up or down progress, pie charts of NIGO by work item type and more.
Personalized Library of Standard Reports
Reporting in Docupace doesn’t just scratch the surface — it provides in-depth details and insights that advisors and back-office staff can use to boost the client experience and grow their firm.
In the new Docupace, reporting is detailed and personalized so that users can easily find the most important information for them. That personalization also allows advisors to dig deeper into certain issues. They may easily be able to see the basic metrics, but then they can go deeper and deeper to find data that leads to the main metrics and other contributing factors.
Users now have an incredible amount of data and information at their fingertips. Easily seeing the data and understanding the context and details around it gives advisors a competitive advantage and a better understanding of their firm and their office.
Docupace is changing, and so is reporting. Our new user experience makes it easy for advisors and firm employees to get the insights they need, track progress and monitor real-time updates — all in a detailed, intuitive and easy-to-understand dashboard.